Image Details
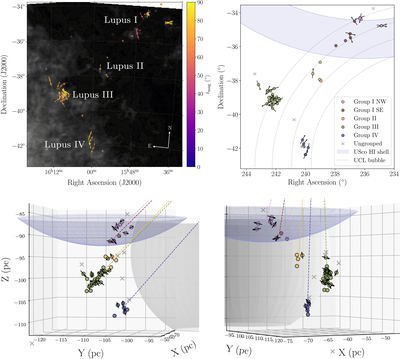
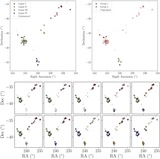
Caption: Figure 1.
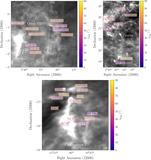
Top left panel: map of the Lupus targets analyzed in this work, with the IRIS 100 μm map (M.-A. Miville-Deschênes & G. Lagache 2005) shown in gray scale. The color bar shows the nominal magnetospheric inclination imag found from the accretion flow model (see Tables 1 and 3). Point sizes indicate dGaia such that more distant sources appear smaller. A labeled version can be found in Figure 3 in the Appendix, along with zoomed-in images of individual subregions. PAs are shown as colored arrows, indicating the projected major axes of the gas disks. They come from H.-W. Yen et al. (2018; thin arrows) and L. Trapman et al. (2025; thick arrows) and are measured from 0° ≤ PA < 360°, defined counterclockwise from north (see compass in the lower right corner). In the remaining panels, the PAs are indicated by black arrows. Top right panel: HDBSCAN group assignments (colors) of the Lupus CTTSs, taking 3D spatial location and imag into account with equal weight. Nongrouped CTTSs are indicated by gray crosses. The shaded blue region indicates the inner and outer boundaries of the USco H I shell projected onto the plane of the sky, and the dotted lines show the projected orientation of the UCL wind bubble (E. J. de Geus 1992; B. Gaczkowski et al. 2017). Bottom panels: 3D versions of the top right panel plotted in International Celestial Reference System Cartesian coordinates using the nominal dGaia values, with each axis spanning 30 pc. The blue curve indicates the outer edge of the USco shell, at 36 pc from its center. The white curve indicates the UCL bubble, which does not have a fixed extent but is plotted at a radius of 21 pc from its center for ease of comparison. The dashed lines show lines of sight between the cluster centroids and Earth. An animated version of this figure is available in the online journal, which rotates the figure 360° around the z-axis to show the 3D structure. The video shows three full rotations over a duration of 1 minute 12 s.
(An animation of this figure is available in the online article.)
(An animation of this figure is available.)
The video/animation of this figure is available in the online journal.
Other Images in This Article

Copyright and Terms & Conditions
© 2025. The Author(s). Published by the American Astronomical Society.