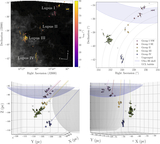
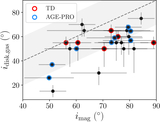
Image Details
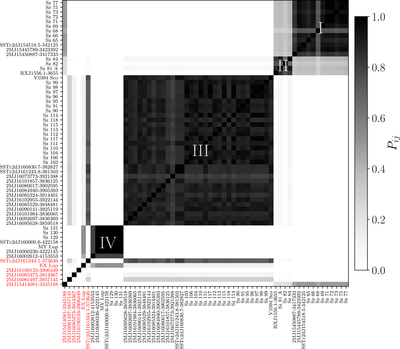
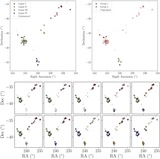
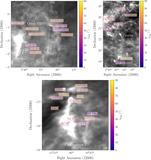
Caption: Figure 4.
Consensus matrix for the 3D groups found from 5000 MC iterations of HDBSCAN, using min_cluster_size = 3, min_samples = 3, and cluster_selection_method = excess of mass. Dark squares indicate groups with high pairwise comembership probabilities (Pij), and Roman numerals indicate the associated Lupus subregions. Red labels indicate CTTSs that are marked as noise in more than 30% of the MC iterations, all of which are off-cloud sources.
Other Images in This Article

Copyright and Terms & Conditions
© 2025. The Author(s). Published by the American Astronomical Society.
Copyright ©
2025 Astronomy Image Explorer. All Rights Reserved.