Image Details
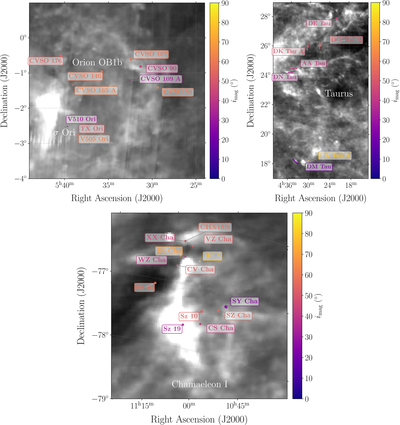
Caption: Figure 10.
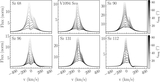
Maps of the Orion (top left), Taurus (top right), and Chamaeleon I (bottom) targets from C. V. Pittman et al. (2025a), with IRIS 100 μm maps (M.-A. Miville-Deschênes & G. Lagache 2005) shown in grayscale. The color bar shows the magnetospheric inclination found from the accretion flow model. Point sizes indicate dGaia such that more distant sources appear smaller. PAs compiled by M. Aizawa et al. (2020) are shown as colored bars. They are determined from 0° ≤ PA < 180° rather than 0° ≤ PA < 360°. The imag and PA values in Orion OB1b and Taurus may be spatially correlated, though the samples are too small to confirm.
Other Images in This Article

Copyright and Terms & Conditions
© 2025. The Author(s). Published by the American Astronomical Society.