Image Details
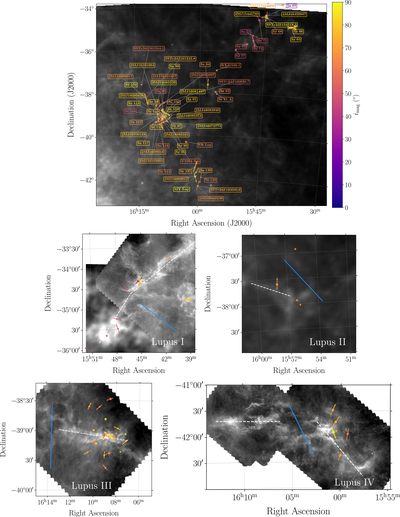
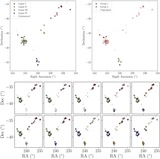
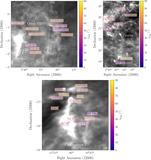
Caption: Figure 3.
Top panel: same as the top left panel of Figure 1, but with CTTS names labeled. Arrows again denote disk PAs. Lower panels: zoomed-in regions around Lupus I (middle left), Lupus II (middle right), Lupus III (bottom left), and Lupus IV (bottom right). Dashed white lines show the approximate orientation and extent of the primary filaments in the plane of the sky. Blue lines show the mean magnetic field direction, and the line length is 3 pc in the plane of the sky to give a broad indication of the detected correlation scale. High-resolution background images show the Herschel SPIRE 250 μm dust continuum maps from the Herschel Gould Belt Survey (P. André et al. 2010), and low resolution images show the IRIS 100 μm map (M.-A. Miville-Deschênes & G. Lagache 2005). Points are colored by imag according to the color bar in the top panel.
Other Images in This Article

Copyright and Terms & Conditions
© 2025. The Author(s). Published by the American Astronomical Society.