Image Details
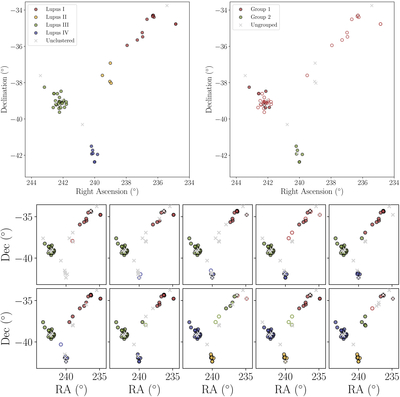
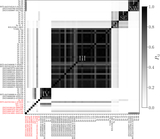
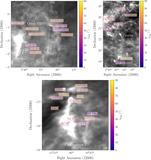
Caption: Figure 6.
Clustering procedure tests, where points are colored by cluster assignment. Filled points indicate high-probability group members (﹩{P}_{ij,{\rm{mean}}}\gt {P}_{{\rm{\min }}}﹩), whereas open points indicate lower-probability members (﹩{P}_{ij,{\rm{mean}}}\leqslant {P}_{{\rm{\min }}}﹩). Gray crosses indicate ungrouped sources marked as noise (﹩{P}_{{\rm{noise}}}\gt {P}_{{\rm{noise}},{\rm{\max }}}﹩). Top left panel: successful clustering of the four Lupus subregions achieved with HDBSCAN using min_cluster_size = 3, min_samples = 3, and cluster_selection_method = excess of mass and coherence clustering thresholds of ﹩{P}_{{\rm{\min }}}﹩ = 0.5 and ﹩{P}_{{\rm{noise}},{\rm{\max }}}﹩ = 0.3, taking only the 3D coordinates into account. These parameters are used for all clustering processes. Top right panel: groups found when assigning randomly generated imag values that are consistent with the observed imag distribution to each MC sample as the fourth dimension in HDBSCAN. Bottom panels: groups found when perturbing randomly assigned imag values by our measured ﹩{\sigma }_{{i}_{{\rm{mag}}}}﹩ values, shown for a representative set of the 100 total iterations.
Other Images in This Article

Copyright and Terms & Conditions
© 2025. The Author(s). Published by the American Astronomical Society.