Image Details
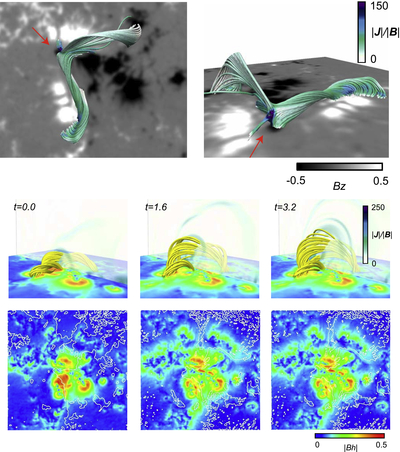
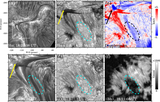
Caption: Figure 5.
The MFR in the NLFFF model and the MHD simulation of magnetic field evolution. Top two panels: top and side views of the MFR, superimposed on the HMI photospheric Bz map taken at 17 UT. The red arrow indicates the location of the magnetic NP. Middle panels: simulated 3D magnetic field lines (with vertical cross sections of ∣J∣/∣B∣) at Alfvén time t = 0.0, 1.6, and 3.2. Bottom panels: the top views of simulated horizontal magnetic field strengths in the photospheric layer (at an altitude of ∼400 km) at t = 0.0, 1.6, and 3.2. The color bar values for Bz and ∣Bh∣ represent percentages relative to their maximum values.
Other Images in This Article
Copyright and Terms & Conditions
© 2025. The Author(s). Published by the American Astronomical Society.