Image Details
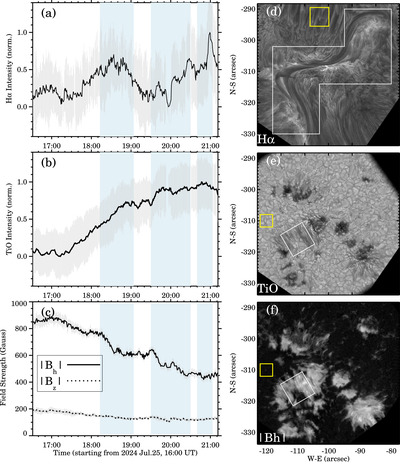
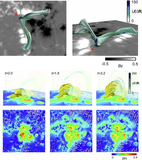
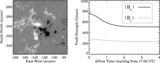
Caption: Figure 3.
The temporal correlation between the penumbra disappearance and the filament peeling. (a) Time evolution of the normalized Hα intensity (averaged over the white polygon region in (d)). (b) Time evolution of the normalized TiO intensity (averaged over the white boxed region in (e)). (c) Time evolutions of ∣Bh∣ and ∣Bz∣ (both averaged over the white boxed region in (f)). Gray error bars represent the standard deviation calculated from a quiescent region shown as the yellow boxed region in the corresponding image. The shaded regions in (a)–(c) indicate the periods in which filament peeling occurs intensively. (d)–(f) The images of GST Hα, TiO, and horizontal magnetic field strength taken at about 18:21 UT, with the white and yellow boxes defining the regions where the Hα intensity, TiO intensity, and magnetic field strength and their uncertainties are computed, respectively. An animation of the evolution of photospheric magnetic field is available. The animation lasts 16 s, with the left and right panels showing vertical and horizontal photospheric magnetograms, respectively.
(An animation of this figure is available in the online article.)
(An animation of this figure is available.)
The video/animation of this figure is available in the online journal.
Other Images in This Article
Copyright and Terms & Conditions
© 2025. The Author(s). Published by the American Astronomical Society.