Image Details
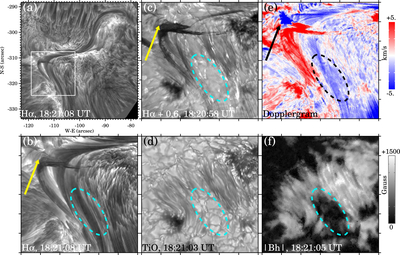
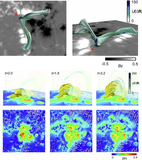
Caption: Figure 4.
The spatial correlation between the penumbra disappearance and the filament peeling. (a) GST Hα image taken at 18:21 UT. The box marks a region of interest for the close-up views shown in panels (b)–(f). (b)–(f) The GST images of the Hα center line, Hα+0.6 Å, TiO, Dopplergram, and horizontal field strength ∣Bh∣, all obtained approximately at 18:21 UT. The arrows in these panels point to a strand peeling off from the main body of the filament, and the ovals highlight the area where the penumbra disappears significantly.
Other Images in This Article
Copyright and Terms & Conditions
© 2025. The Author(s). Published by the American Astronomical Society.
Copyright ©
2026 Astronomy Image Explorer. All Rights Reserved.