Image Details
Caption: Figure 6.
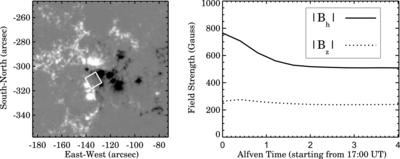
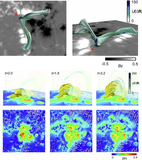
The evolution of penumbral horizontal and vertical field strength in the simulation. Left: HMI Bz map at 17:00 UT, showing the FOV of the bottom boundary of the NLFFF model and the simulation. The box indicates the region of penumbra disappearance, which is the same as the region shown by the box in Figure 3(f). Right: time profiles of ∣Bh∣ (solid) and ∣Bz∣ (dotted), averaged over the boxed region shown in the left panel. The simulation time “0” corresponds to 17:00 UT.
Other Images in This Article
Copyright and Terms & Conditions
© 2025. The Author(s). Published by the American Astronomical Society.
Copyright ©
2026 Astronomy Image Explorer. All Rights Reserved.