Image Details
Caption: Figure 1.
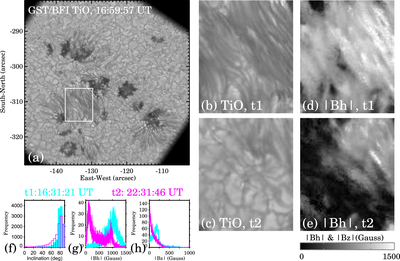
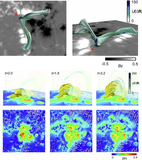
Disappearance of penumbra and changes in the penumbral magnetic field in the photosphere. (a) The GST TiO image taken at ∼17 UT, 2024 July 25. The box marks the FOV of the images shown in the panels (b)–(e). (b)–(c) The TiO images taken at the beginning and the end of the GST observation on that day, denoted by “t1” and “t2,” respectively. The specific times for t1 and t2 are 16:31:21 UT and 22:31:47 UT, respectively. (d)–(e) GST/NIRIS horizontal magnetic field strength ∣Bh∣ at t1 and t2. (f)–(h) Histograms of magnetic inclination angle, ∣Bh∣, and ∣Bz∣ at t1 (cyan) and t2 (pink). The inclination angle is measured with respect to the local surface normal, i.e., 0° is vertical and 90° is horizontal. An animation of the TiO image sequence shows the evolution of the sunspot penumbra. The duration of the animation is 30 s.
(An animation of this figure is available in the online article.)
(An animation of this figure is available.)
The video/animation of this figure is available in the online journal.
Other Images in This Article
Copyright and Terms & Conditions
© 2025. The Author(s). Published by the American Astronomical Society.