Image Details
Caption: Figure 2.
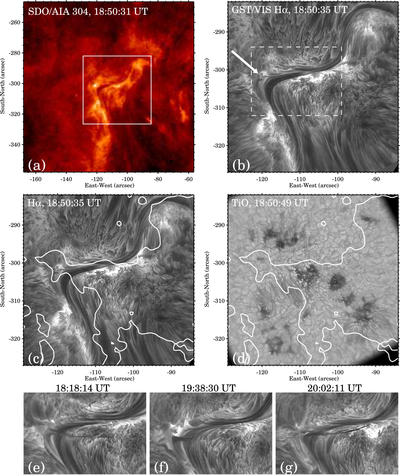
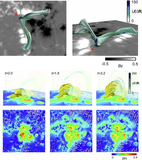
The filament and its peeling process in the chromosphere. (a) The SDO/AIA 304 Å image taken at ∼18:50 UT, where the box indicates the FOV of the GST Hα image shown in panel (b). (b) The GST chromospheric Hα image taken at ∼18:50 UT. The arrow points to a detached filament strand and the associated subflare. The dashed box indicates the FOV of the bottom panels (e)–(g). (c)–(d) The GST chromospheric Hα image and the photospheric TiO image, with the magnetic PILs superimposed on them. (e)–(f) Snapshots of the filament peeling at 18:18:14, 19:38:30, and 20:02:11 UT. An animation of the Hα image sequence shows the filament peeling process. The duration of the animation is 23 s.
(An animation of this figure is available in the online article.)
(An animation of this figure is available.)
The video/animation of this figure is available in the online journal.
Other Images in This Article
Copyright and Terms & Conditions
© 2025. The Author(s). Published by the American Astronomical Society.