Image Details
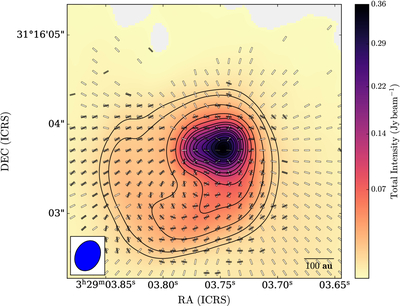
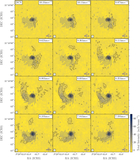
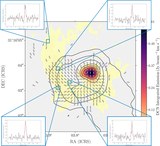
Caption: Figure 16.
A comparison is shown between the polarization position angle map, as black pseudovectors, and the radiation field model, indicated by white pseudovectors. In contours and color scale, we show the total intensity of dust emission. The beam is shown as a blue ellipse in the bottom left corner, and the scale is shown in the bottom right corner of the map.
Other Images in This Article
Show More
Copyright and Terms & Conditions
© 2025. The Author(s). Published by the American Astronomical Society.
Copyright ©
2025 Astronomy Image Explorer. All Rights Reserved.