Image Details

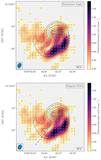
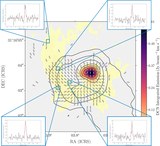
Caption: Figure 13.
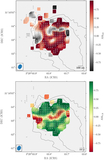
Left panel: the dust emission map shown with robust = 0.5 in color scale and contours using the same levels used in Figure 1. Superposed in white pseudovectors is the intensity gradient. Also, superposed in magenta pseudovectors is the inferred magnetic field derived from the polarized emission, also imaged using robust = 0.5. Right panel: same as the left panel but with the polarization position angle as black pseudovectors. The beam is depicted as a blue ellipse in the bottom left corner, and the scale is displayed in the bottom right corner of each panel.
Other Images in This Article
Show More
Copyright and Terms & Conditions
© 2025. The Author(s). Published by the American Astronomical Society.
Copyright ©
2025 Astronomy Image Explorer. All Rights Reserved.