Image Details
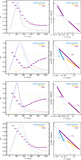
Caption: Figure C1.
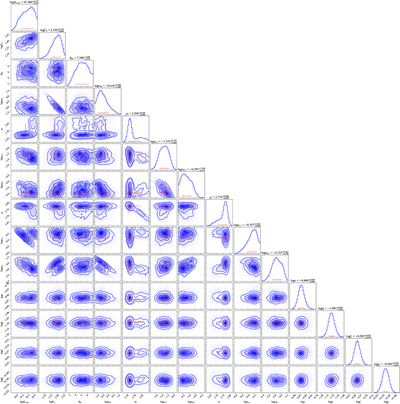
Corner plot of the posterior probability distributions of the parameters for afterglow fitting using the FS+RS model with u-, v-, and g-band correction factors. The red error bars represent 1σ uncertainties.
Other Images in This Article

Copyright and Terms & Conditions
© 2025. The Author(s). Published by the American Astronomical Society.
Copyright ©
2025 Astronomy Image Explorer. All Rights Reserved.