Image Details
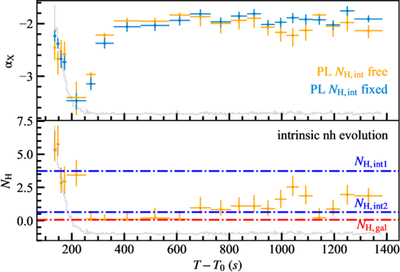
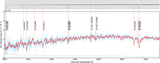
Caption: Figure 4.
The evolution of spectral index αX and intrinsic absorption column density NH,int. The blue (yellow) points in the upper panel represent the best-fit spectral indices in the time-resolved spectral fittings with fixed (free) NH,int. The yellow points in the lower panels correspond to the best-fit NH,int. The two blue dotted–dashed horizontal lines mark the best-fit intrinsic absorption column density NH,int1 and NH,int2 obtained from time-integrated spectral fittings, respectively. The red dotted–dashed horizontal line denotes the Galactic absorption column density NH,gal. All error bars on data points represent their 1σ confidence level.
Other Images in This Article

Copyright and Terms & Conditions
© 2025. The Author(s). Published by the American Astronomical Society.