Image Details
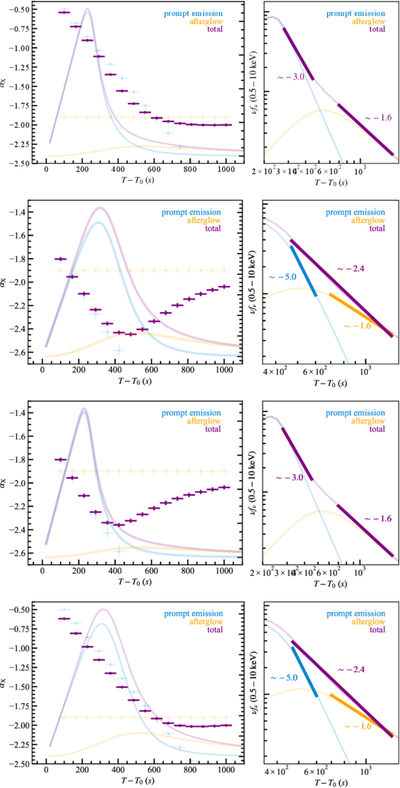
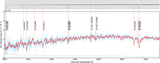
Caption: Figure 5.
The spectral index evolutions and light curves for four scenarios of the transition from the prompt emission to the afterglow in the long-duration fast X-ray transients. The purple, blue, and yellow dots represent the spectral indices of the total, prompt, and afterglow emission spectra. The colored curves demonstrate the flux evolution in linear and logarithmic scale. From top to bottom: case I, case II, case III, and case IV.
Other Images in This Article

Copyright and Terms & Conditions
© 2025. The Author(s). Published by the American Astronomical Society.
Copyright ©
2025 Astronomy Image Explorer. All Rights Reserved.