Image Details
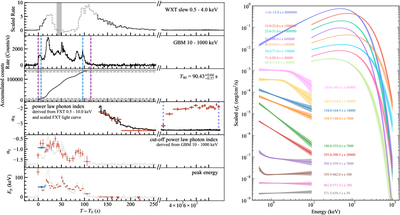
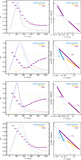
Caption: Figure 1.
Left: the observed light curve of EP250404a detected by EP/WXT in the energy range of 0.5–4.0 keV, the observed light curve of GRB 250404A detected by Fermi/GBM in the energy range of 10–1000 keV and the accumulated counts, and the spectral evolution based on the best-fit parameters of the CPL, PL, and SBPL models. The gray block marks the time interval where the source was outside the field of view of the detector. The dashed curve in the WXT light curve indicates a significant slew of the WXT telescope during the main emission phase, during which flux measurements may be affected. The blue dashed vertical lines represent the T90 interval, and the purple dashed vertical lines in the GBM light curve denote T100, with solid (dashed) gray horizontal lines indicating the 0% (5%) and 100% (95%) levels, respectively. The dark blue dashed vertical lines in the FXT (fourth) panel correspond to the time interval where the spectra start to harden and reach a plateau. Right: the evolution of the SEDs. The SEDs are derived from the spectral fittings at different time intervals listed in Tables A1 and A2. All error bars mark the 1σ confidence level.
Other Images in This Article
Copyright and Terms & Conditions
© 2025. The Author(s). Published by the American Astronomical Society.