Image Details
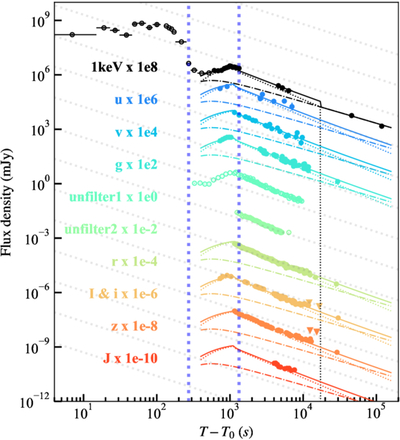
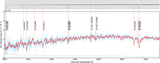
Caption: Figure 2.
Multiwavelength observations of GRB 250404A/EP250404a and afterglow modeling with the best-fit parameters from the FS+RS model with u-, v-, and g-band correction factors. The multiwavelength data utilized in the afterglow fitting are marked with filled points, while the optical observations on clear filters that are not included in the afterglow fitting are marked with open points. The optical and near-infrared data have been corrected for Galactic extinction, which is E(B − V) = 0.073 mag (E. F. Schlafly & D. P. Finkbeiner 2011). We assume a total to selective extinction ratio of RV = 3.1 according to the extinction law from E. L. Fitzpatrick (1999). The inverted triangle points signify upper limits. The best-fit FS+RS, FS, and RS models are shown with solid, dashed–dotted, and dotted lines, respectively. The dark blue dashed vertical lines correspond to the same time interval where the spectra start to harden and reach a plateau.
Other Images in This Article

Copyright and Terms & Conditions
© 2025. The Author(s). Published by the American Astronomical Society.