Image Details
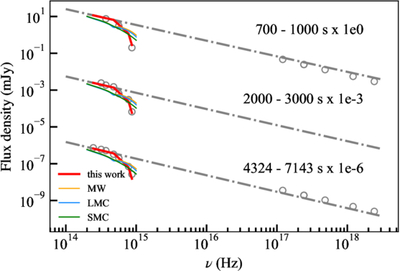
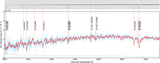
Caption: Figure 3.
X-ray/optical/near-infrared afterglow specific flux density spectra of GRB 250404A/EP250404a in different time intervals. The best-fit afterglow model is indicated by dashed–dotted gray lines. The red curves correspond to the partial host galaxy extinction curve derived from the best-fit correction factors from the afterglow modeling. For comparison, the yellow, blue, and green curves show the average extinction laws of the MW, SMC, and LMC, respectively, assuming a reddening value of E(B − V) = 0.1 mag.
Other Images in This Article

Copyright and Terms & Conditions
© 2025. The Author(s). Published by the American Astronomical Society.
Copyright ©
2025 Astronomy Image Explorer. All Rights Reserved.