Image Details
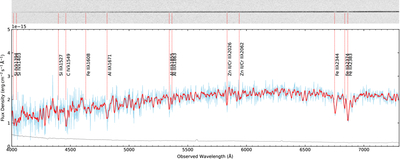
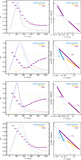
Caption: Figure B1.
The optical spectrum observed by the GMG-2.4 m telescope. The wavelength-calibrated 2D spectrum and the corresponding flux-calibrated 1D spectrum are shown. The 1D raw, smoothed, and error spectra are shown in sky blue, red, and gray lines, respectively. Multiple metal absorption lines at a redshift of z = 1.88 are marked with vertical dashed lines. Note that the flux calibration should be treated with caution due to the absence of a standard star observation on the same night. Instead, a previously obtained standard star spectrum was used for the flux calibration.
Other Images in This Article

Copyright and Terms & Conditions
© 2025. The Author(s). Published by the American Astronomical Society.
Copyright ©
2025 Astronomy Image Explorer. All Rights Reserved.