Image Details
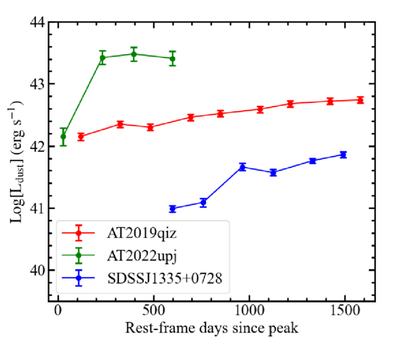
Caption: Figure 6.
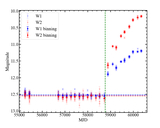
The dust luminosity evolution of QPE-associated TDEs AT 2019qiz and AT 2022upj and TDE candidate SDSS J1335+0728. The dust luminosity is derived in the same way as in N. Jiang et al. (2021a), assuming Si grains with a size distribution of N(a) ∝ a−3.5 and taking into account the absorption coefficient. The rest-frame days since peak are relative to the date of the optical flare peak (MJD ∼ 58767.61, ∼59885, and ∼58991, respectively).
Other Images in This Article
Copyright and Terms & Conditions
© 2025. The Author(s). Published by the American Astronomical Society.
Copyright ©
2025 Astronomy Image Explorer. All Rights Reserved.