Image Details
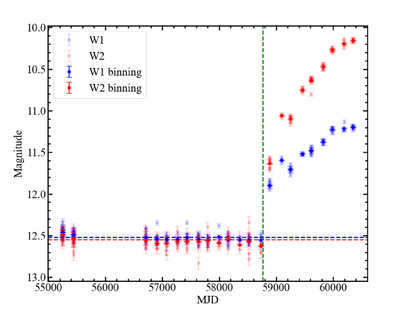
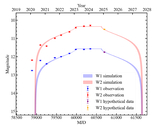
Caption: Figure A1.
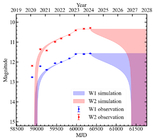
The WISE light curves of AT 2019qiz. Blue dots: W1 (3.4 μm); red squares: W2 (4.6 μm). The raw single exposures are plotted in light blue and red, while the binned data are plotted in dark blue and red. The red and blue dashed lines denote the average magnitudes at the quiescent phase. The green dashed line marks the time of optical peak.
Other Images in This Article
Copyright and Terms & Conditions
© 2025. The Author(s). Published by the American Astronomical Society.
Copyright ©
2025 Astronomy Image Explorer. All Rights Reserved.