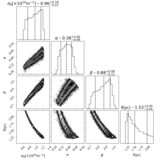
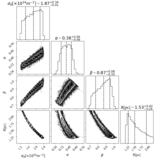
Image Details
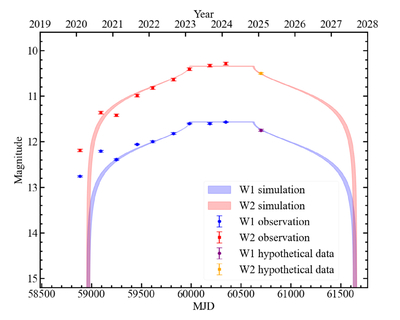
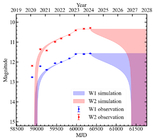
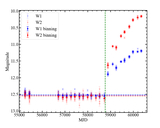
Caption: Figure A5.
This figure is similar to Figure 5 but with a set of data artificially added at MJD = 60700 for the fitting process, showing the simulated IR light curves. The purple and orange dots denote the hypothetical W1 and W2 data in the decline phase, respectively.
Other Images in This Article
Copyright and Terms & Conditions
© 2025. The Author(s). Published by the American Astronomical Society.
Copyright ©
2025 Astronomy Image Explorer. All Rights Reserved.