Image Details
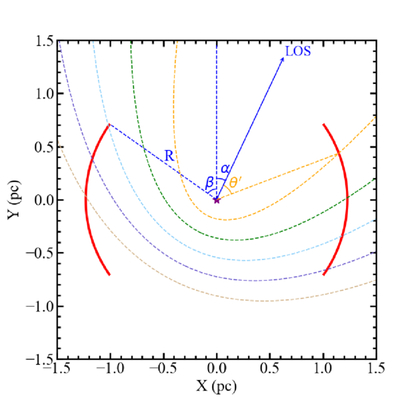
Caption: Figure 3.
Schematic picture of the dust echo model. The central SMBH and dusty torus are shown in purple and red, respectively. The dashed parabolas illustrate the isodelay surface at lags of 400, 800, 1200, 1600, and 2000 days, respectively.
Other Images in This Article
Copyright and Terms & Conditions
© 2025. The Author(s). Published by the American Astronomical Society.
Copyright ©
2025 Astronomy Image Explorer. All Rights Reserved.