Image Details
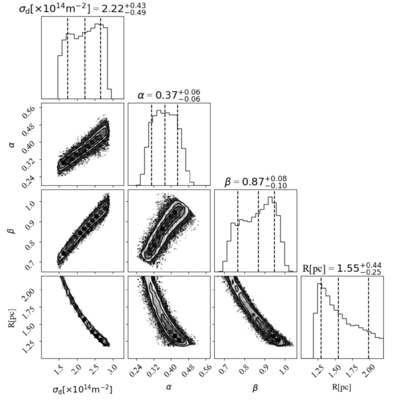
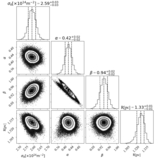
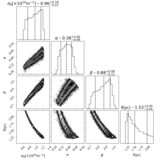
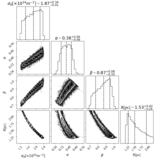
Caption: Figure 4.
The distribution of the Si dust echo model parameters for AT 2019qiz. The values and errors above the plots correspond to the 15.87%, 50%, and 84.13% quantile values of the posterior samples of the parameters, and the black dashed lines show the locations of these values in the plots. The contours in the 2D contour plots reflect the relative numerical density, where darker color means a larger numerical density.
Other Images in This Article
Copyright and Terms & Conditions
© 2025. The Author(s). Published by the American Astronomical Society.
Copyright ©
2025 Astronomy Image Explorer. All Rights Reserved.