Image Details
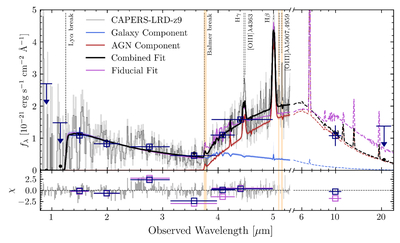
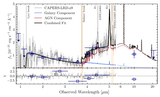
Caption: Figure 8.
Spectrum and 1σ errors of CAPERS-LRD-z9 (gray curve, light gray shading), the best-fit host galaxy component (solid and dashed blue curves), the best-fit dense-gas-enshrouded AGN component (solid and dashed red curves), combined host+AGN fit (solid and dashed black curves), fiducial SMC dust law fit (solid and dashed purple curves), photometry data (dark blue squares and upper limits), best-fit model photometry (black points) in the upper panel, and masked regions (gold shading). The lower panel shows the χ residuals of the fit for the spectrum (gray curve) and photometry (dark blue squares). Note that the flexible (yet unphysically steep) AGN dust law allows for strong agreement with the MIRI F1000W flux that cannot be reproduced by an SMC law.
Other Images in This Article
Copyright and Terms & Conditions
© 2025. The Author(s). Published by the American Astronomical Society.