Image Details
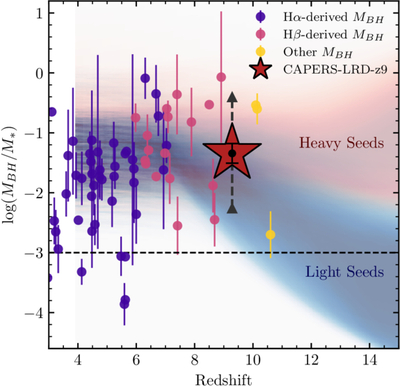
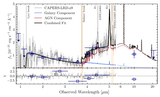
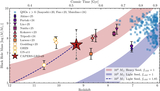
Caption: Figure 5.
Black hole mass to stellar mass ratio ﹩{\mathrm{log}}\,\left({M}_{{\rm{BH}}}/{M}_{* }\right)﹩ as a function of redshift for CAPERS-LRD-z9 (red star) and a collection of literature JWST-detected AGN (Y. Harikane et al. 2023; D. D. Kocevski et al. 2023, 2025; V. Kokorev et al. 2023, 2024a; R. L. Larson et al. 2023; Á. Bogdán et al. 2024; L. J. Furtak et al. 2024; I. Labbe et al. 2024; R. Maiolino et al. 2024; L. Napolitano et al. 2024; R. Tripodi et al. 2024; H. Übler et al. 2024; B. Wang et al. 2025; M. Yue et al. 2024b; H. B. Akins et al. 2025a; I. Juodžbalis et al. 2025), showing the published errors, typically exclusive of systematic uncertainties. We divide the literature-selected samples into those selected based on a broad Hα line (purple points), a broad Hβ line (pink points), and based on UV line or X-ray detections (yellow points). We plot the statistical errors on CAPERS-LRD-z9 as the black error bars, and we include a larger systematic range on ﹩{\mathrm{log}}\,\left({M}_{{\rm{BH}}}/{M}_{* }\right)﹩ based on the systematic limits on the black hole mass of CAPERS-LRD-z9 as a gray dashed line and upward-pointing arrows. We stress that as our M* measurement is an upper limit, all of our measurements of MBH/M* are lower limits. We plot the MBH/M* = 0.1% value for local galaxies as a black dashed line. For comparison, we overlay the predicted evolution of MBH/M* ratios from early black hole populations formed via two distinct seeding channels: heavy seeds (red shaded region) and light seeds (blue shaded region), based on the semianalytical model presented in H. Hu et al. (2025). The population of JWST-detected AGN exhibits an apparent overmassiveness in this ratio compared to the local relation.
Other Images in This Article
Copyright and Terms & Conditions
© 2025. The Author(s). Published by the American Astronomical Society.