Image Details
Caption: Figure 2.
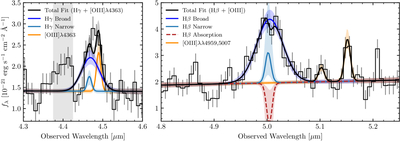
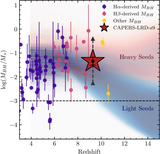
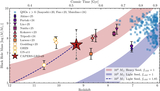
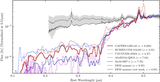
The observed NIRSpec/PRISM spectrum of CAPERS-LRD-z9 is shown as the fine black curve with uncertainties in gray. Left: line fits and 1σ uncertainties on Hγ (blue curves and shaded regions), [O III] λ4363 (orange curve and shaded region), and the combined fit (thick black curve and shaded region). We deblend these lines using the high-confidence line widths and redshift solution measured from Hβ + [O III] λλ4959, 5007. We show the region of masked spurious pixels with gray shading. Right: line fits to Hβ + [O III] λλ4959, 5007. A broad (FWHM = 3521 ± 502 km s−1; blue curve) component is clearly necessary to reproduce the Hβ. We also fit narrow emission (light blue) and absorption (dashed red) components to Hβ to better model the double-peak structure of the line, though their fluxes are degenerate at PRISM resolution. The [O III] λλ4959, 5007 doublet is also detected at S/N ∼ 4. The combination of narrow [O III] λλ4959, 5007 and broad Hβ is a clear indicator of a BLAGN.
Other Images in This Article
Copyright and Terms & Conditions
© 2025. The Author(s). Published by the American Astronomical Society.