Image Details
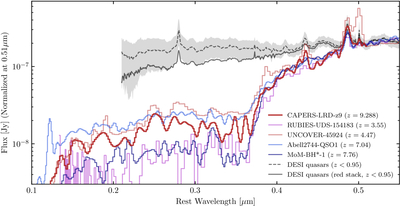
Caption: Figure 7.
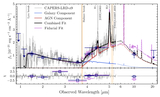
The NIRSpec MSA/PRISM spectra of CAPERS-LRD-z9, MoM-BH*-1 at z = 7.76 (R. P. Naidu et al. 2025), RUBIES-UDS-154183 at z = 3.55 (A. de Graaff et al. 2025), UNCOVER-45924 at z = 4.47 (I. Labbe et al. 2024), and A2744-QSO1 at z = 7.04 (L. J. Furtak et al. 2024; X. Ji et al. 2025) normalized to the spectrum of CAPERS-LRD-z9 at rest-frame 0.51 μm. We apply a 1–2 pixel Gaussian smoothing (smoothing lower-z objects less, as they are already relatively smoothed by PRISM’s lower spectral resolution at bluer observed wavelengths) to all five spectra to increase visual clarity. For comparison, we plot the median and 10th–90th percentile of DESI spectra of 232 quasars (z < 0.95) selected to have similar values of Hβbroad FWHM, L([O III] λ5007), and [O III] λ5007/Hβ flux ratio (gray shading and gray dashed curve) and the stack of the reddest 20 DESI quasars (gray solid curve). While the rest-optical emission from CAPERS-LRD-z9 strongly resembles that of the other NIRSpec sources, these sources are all starkly different from quasars identified in DESI, where even the reddest DESI quasars fail to approach the reddening or Balmer break exhibited in the NIRSpec LRDs.
Other Images in This Article
Copyright and Terms & Conditions
© 2025. The Author(s). Published by the American Astronomical Society.