Image Details
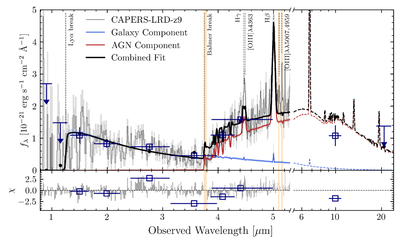
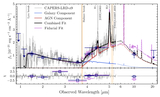
Caption: Figure 4.
Spectrum and 1σ errors of CAPERS-LRD-z9 (gray curve, light gray shading), the best-fit host galaxy component (solid and dashed blue curves), the best-fit dense-gas-enshrouded AGN component (solid and dashed red curves), combined host+AGN fit (solid and dashed black curves), photometry data (dark blue squares and upper limits), best-fit model photometry (black points) in the upper panel, and masked regions (light orange shading). The lower panel shows the χ residuals of the fit for the spectrum (gray curve) and photometry (dark blue squares). Note that neither the bagpipes stellar model nor the Cloudy AGN model can match the strong [O III] λ4363 emission.
Other Images in This Article
Copyright and Terms & Conditions
© 2025. The Author(s). Published by the American Astronomical Society.