Image Details
Caption: Figure 7.
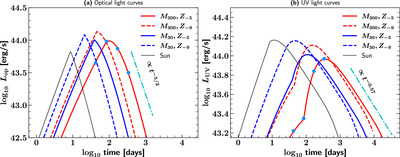
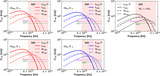
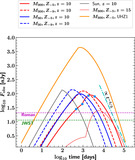
Optical (left) and UV (right) light curves of the Pop III star TDEs around a MBH with M BH = 106 M ⊙ in comparison to that that of a solar-type star. The color and line styles for different stars are the same as in Figure 3. For the fiducial Pop III star TDE model (the red solid curve), we mark the four epochs used in Figure 6(a) (i.e., t edge/2, t edge, 2× t edge, and 4× t edge) using light blue dots. The late-time light curves are fitted with power-law functions that are plotted using cyan dotted–dashed lines. We see that the Pop III star TDEs have much longer rise and decay timescales compared to standard TDEs of normal stars. Furthermore, for a Pop III star TDE, while its optical light curves follow the debris fallback rate relatively closely and peaks around t edge, its UV light curve peaks at a later time and decays much more slowly due to the temperature evolution of the flare.
Other Images in This Article
Show More
Copyright and Terms & Conditions
© 2024. The Author(s). Published by the American Astronomical Society.