Image Details
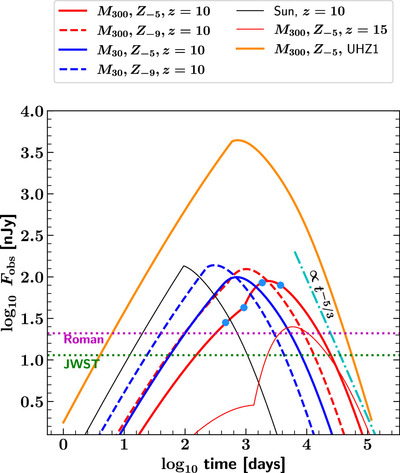
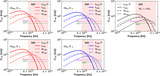
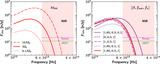
Caption: Figure 10.
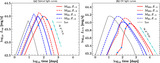
We show the NIR light curves of Pop III star TDEs in comparison to that of a solar-type star. The integrated NIR flux are in the JWST NIRcam band. All TDEs happen around a MBH with M BH = 106 M ⊙ at z = 10. Color schemes and line styles are the same as in Figure 7. Furthermore, for the default model of Pop III stars (M ⋆ = 300M ⊙ = M 300, Z = 10−5 = Z −5), we also show the observed NIR light curve when the TDE happens at z = 15 (red thin line) or when the MBH is a UHZ1-like source with M BH = 4 × 10⁷ M ⊙ at z = 10.1 (orange line). The late-time light curves are compared to a power-law decay pattern of t −5/3 (cyan dotted–dashed line). Green and magenta dotted solid lines denote the flux limit of NIRCam (F150W) and WFI (F106), respectively. It is noticed that the observed NIR light curves evolve very slowly due to cosmological time dilation.
Other Images in This Article
Show More
Copyright and Terms & Conditions
© 2024. The Author(s). Published by the American Astronomical Society.