Image Details
Caption: Figure 8.
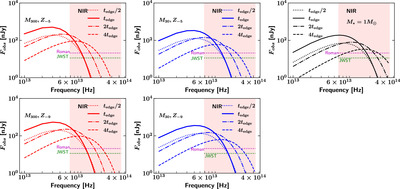
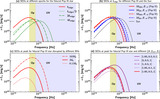
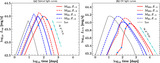
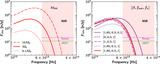
The observed fluxes of TDEs of Pop III stars of mass 300M ⊙ (M 300, left panel) and 30M ⊙ (M 30, middle panel) with different metallicities of 10−5 (Z −5, top panel) and 10−9 (Z −9, bottom panel) compared to a solar-type star (right panel) at different epochs (t edge/2, t edge, 2t edge, 4t edge). Green dotted line shows the sensitivity limit of the F150W filter of NIRCam. Magenta dotted line represents the sensitivity limit of the F106 filter of WFI, which has the best sensitivity limit of all the four filters (F106, F129, F158, F184) used in the High Latitude Wide Area Survey. Red shaded regions indicate JWST NIRcam bands. It can be seen that a large part of the fluxes are in the NIR wavelengths and lie above the detection limit of JWST’s NIRCam and Roman’s WFI.
Other Images in This Article
Show More
Copyright and Terms & Conditions
© 2024. The Author(s). Published by the American Astronomical Society.