Image Details
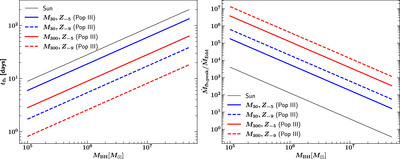
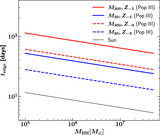
Caption: Figure 3.
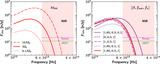
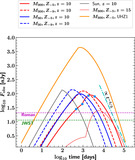
Left panel: debris mass fallback time t fb for tidal disruption of 300M ⊙ (M 300, red) and 30M ⊙ (M 30, blue) Pop III stars with Z = 10−5 (Z −5, solid lines) and Z = 10−9 (Z −9, dashed lines) compared to a regular 1M ⊙ star (black solid line). Right panel: Eddington ratio of the peak debris mass fallback rate ﹩{\dot{M}}_{\mathrm{fb},\mathrm{peak}}﹩ for the same stars as in the left panel. Pop III stars have shorter fallback times and much higher peak mass fallback rates compared to Pop I star TDEs.
Other Images in This Article
Show More
Copyright and Terms & Conditions
© 2024. The Author(s). Published by the American Astronomical Society.