Image Details
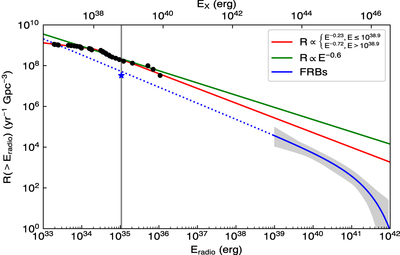
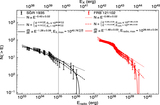
Caption: Figure 8.
Energy-dependent event rate densities of magnetar X-ray bursts and FRBs. Black circles represent the cumulative energy distribution of our sample scaled to the whole magnetar population. The red line shows its best-fitted broken PL model. The green line is the rate density of giant flares derived from Beniamini et al. (2019). The event rate density of FRBs (Luo et al. 2020) and its extrapolation is shown by the blue solid and dotted line. The gray shaded area represents the 2σ confidence region. The blue star is the event rate density inferred from FRB 200428.
Other Images in This Article
Copyright and Terms & Conditions
© 2021. The American Astronomical Society. All rights reserved.
Copyright ©
2026 Astronomy Image Explorer. All Rights Reserved.