Image Details
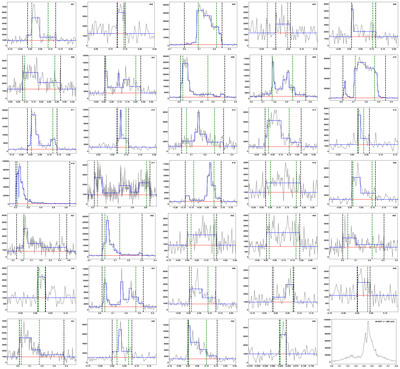
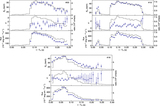
Caption: Figure 1.
Light curves of SGR J1935+2154. For each burst, only the detector with the smallest viewing angle to the source direction is used for its light curve plot. The energy range is 8–200 keV. The gray, blue, and red lines denote the count rates light curve, bayesian blocks, and background, respectively. The black and green vertical dashed lines show time intervals of Tbb and T90. Bottom right: the light curve of the FRB-associated burst observed by HXMT in the energy range of 1–250 keV (Li et al. 2020).
Other Images in This Article
Copyright and Terms & Conditions
© 2021. The American Astronomical Society. All rights reserved.
Copyright ©
2026 Astronomy Image Explorer. All Rights Reserved.