Image Details
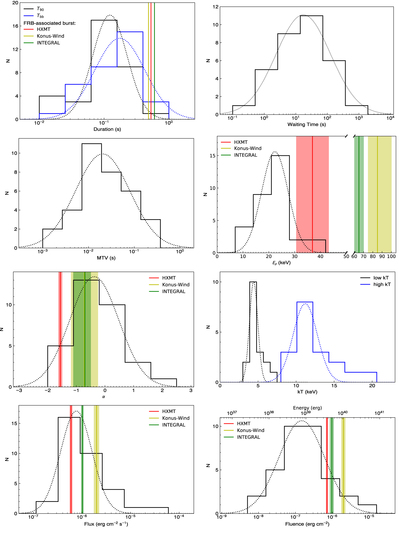
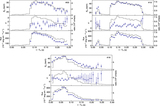
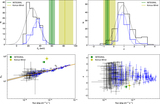
Caption: Figure 2.
Distributions of characteristic timescales, time-integrated spectral fitting parameters, and other derived parameters. Flux, fluence, and energy are calculated in the energy band of 8–200 keV. The dotted curves are the best Gaussian fits to the histograms. The red/green/yellow vertical lines and corresponding shadow areas represent the parameter values and errors of the FRB-associated burst obtained with HXMT/INTEGRAL/Konus-Wind (Li et al. 2020; Mereghetti et al. 2020; Ridnaia et al. 2020).
Other Images in This Article
Copyright and Terms & Conditions
© 2021. The American Astronomical Society. All rights reserved.
Copyright ©
2026 Astronomy Image Explorer. All Rights Reserved.