Image Details
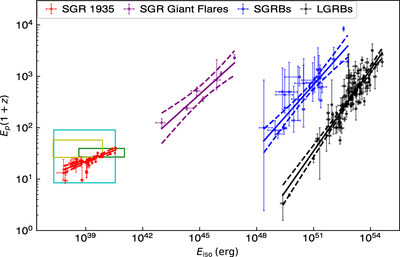
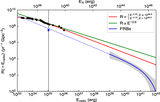
Caption: Figure 4.
Ep–Eiso correlation of SGR J1935+2154 bursts in our sample compared with that of long and short GRBs, as well as SGR giant flares (Mazets et al. 1982, 1999, 2008; Hurley et al. 1999, 2005; Aptekar et al. 2001; Ofek et al. 2006, 2008; Frederiks et al. 2007a, 2007b; Tanaka et al. 2007; Yang et al. 2020). The solid and dashed lines represent the best-fitting result and 95% confidence intervals of fitting uncertainties for different populations. The green, yellow, and cyan boxes represent the range of Ep and Eiso for the previous bursts of SGRs J1935+2154 (Lin et al. 2020a), J0501+4516 (Lin et al. 2011), and J1550-5418 (van der Horst et al. 2012).
Other Images in This Article
Copyright and Terms & Conditions
© 2021. The American Astronomical Society. All rights reserved.