Image Details
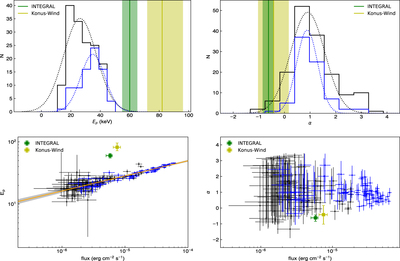
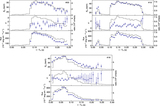
Caption: Figure 6.
Top row: distributions of Ep (left) and photon index (right) of the CPL model fits for resolved spectra. The dotted curves are Gaussian fits to the histograms. Bottom row: the evolution of Ep (left) and photon index (right) as a function of flux. The green/yellow vertical lines, corresponding shadow areas and data points, have the same meaning mentioned in Figures 2 and 3 but for spectra with narrower time intervals around the peak of the light curve of the FRB-associated burst. The contribution of three brightest bursts (#03, 10, 16) are highlighted in blue. The yellow solid line is the best power-law fitting result. The gray area shows the 95% confidence interval of fitting uncertainties.
Other Images in This Article
Copyright and Terms & Conditions
© 2021. The American Astronomical Society. All rights reserved.