Image Details
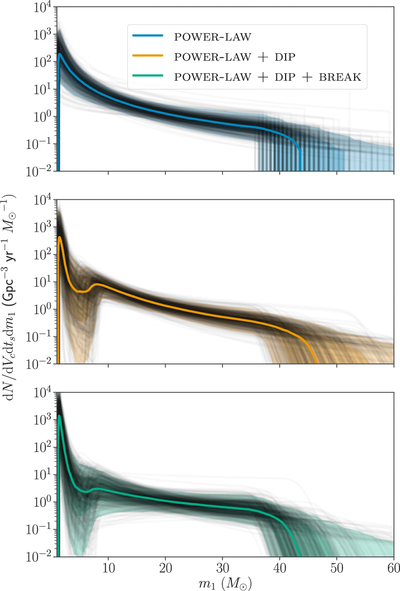
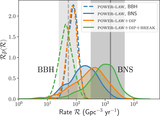
Caption: Figure 3.
Posterior population distributions for three models, in order of increasing complexity: POWER LAW, POWER LAW + DIP, and POWER LAW + DIP + BREAK. Each panel shows the differential merger rate density, ﹩{dN}/{{dV}}_{c}{{dt}}_{s}{{dm}}_{1}﹩, as a function of primary mass m1. The colored lines show the median rate density, and the colored shaded bands show 1σ (68%) and 2σ (95%) credible intervals. In gray, we plot 500 draws from the population posterior under each model.
Other Images in This Article

Copyright and Terms & Conditions
© 2020. The American Astronomical Society. All rights reserved.
Copyright ©
2026 Astronomy Image Explorer. All Rights Reserved.