Image Details
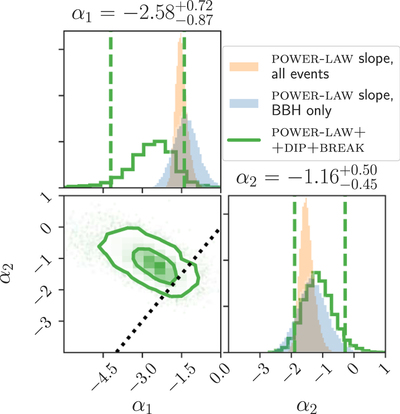
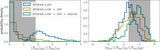
Caption: Figure 6.
Joint posterior on the power-law slopes α1 (NS mass range) and α2 (BH mass range) for the full POWER LAW + DIP + BREAK model (green). The two-dimensional contours show 50% and 90% credible regions, while vertical dashed lines show one-dimensional 90% credible intervals. For comparison, we show the power-law slope inferred under the POWER-LAW fit to (blue) only the BBH and (orange) all GWTC-1 events. We recover α1 < α2 with 91% credibility; α1 = α2 in this model reduces to the POWER LAW + DIP model.
Other Images in This Article

Copyright and Terms & Conditions
© 2020. The American Astronomical Society. All rights reserved.
Copyright ©
2026 Astronomy Image Explorer. All Rights Reserved.