Image Details
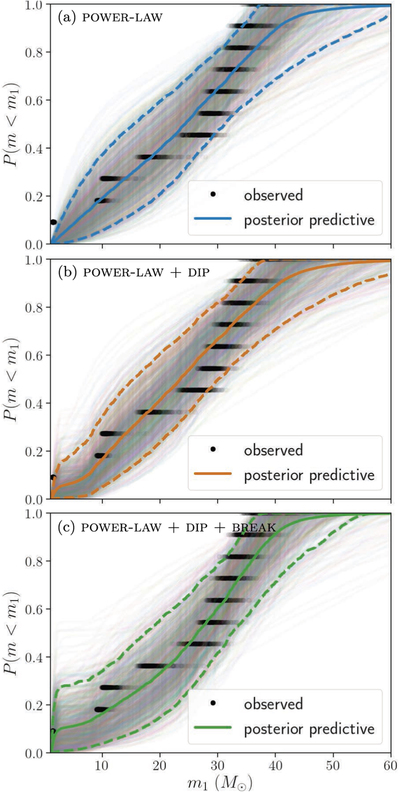
Caption: Figure 4.
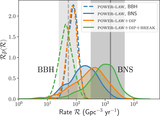
Posterior predictive check comparing the observed primary mass distribution as predicted from our models (thin colored curves; each curve corresponds to a draw from the hyperparameter posterior) with the empirical distribution from the 11 GWTC-1 events (black; each point corresponds to a draw from the population-informed single-event posterior). The solid colored line in each panel corresponds to the posterior average (mean) of the predicted distributions, while the two dashed colored lines denote the symmetric 90% interval around the predicted curves. The model is a good fit to the data if the empirical distribution (black) is contained within the range of model predictions (colored). The top panel shows that the POWER-LAW model has trouble accounting for GW170817, while the other models account for all 11 events.
Other Images in This Article

Copyright and Terms & Conditions
© 2020. The American Astronomical Society. All rights reserved.