Image Details
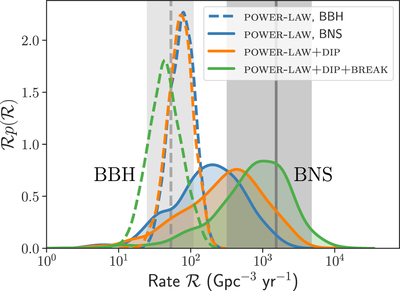
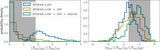
Caption: Figure 7.
Astrophysical merger rate within two different mass bins: for BNS, 1 M⊙ < m2 < m1 < 2.5 M⊙, and for BBH, 5 M⊙ < m2 < m1 < 100 M⊙, as inferred by each of the models. The dashed open probability density curves centered below ﹩{ \mathcal R }\sim {10}^{2}\,\ {\mathrm{Gpc}}^{-3}\ {\mathrm{yr}}^{-1}﹩ show the BBH rate inference and the solid filled curves show the BNS rate inference for the POWER LAW (blue), POWER LAW + DIP (orange), and POWER LAW + DIP + BREAK (green) models. For comparison, the gray shaded regions show the median and 90% credible intervals of the BBH (dashed) and BNS (solid) rates inferred by the LVC in Abbott et al. (2019a, 2019b). Allowing for a dip and break between NS and BH masses tends to decorrelate the merger rates, increasing the inferred BNS merger rate and decreasing the BBH merger rate.
Other Images in This Article

Copyright and Terms & Conditions
© 2020. The American Astronomical Society. All rights reserved.