Image Details
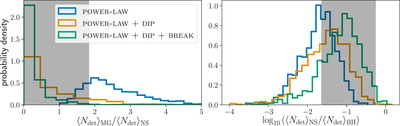
Caption: Figure 5.
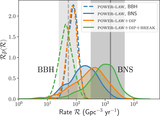
Left: ratio of the expected number of detections with primary mass in the MG (defined here as 2.5–5 M⊙) compared to the expected number of NS detections (defined here as 1–2.5 M⊙). Right: ratio of the expected number of detections with an NS primary mass (in the mass range 1–2.5 M⊙) compared to a BH primary mass (in the mass range 5 M⊙–100 M⊙). Here GWTC-1 contains zero events with m1 in the MG, one BNS, and 10 BBHs, leading us to measure an mass-gap–NS ratio of ∼zero and an NS–BH ratio of ∼0.1; the 90% highest posterior density credible intervals on these values are shown by the gray shaded regions (see the text for more detail). The simple POWER-LAW model predicts at least as many mass gap detections as NS detections. Meanwhile, when we allow for both a dip and a break in the power law, we lower the expected fraction of mass-gap detections and raise the expected fraction of NS detections relative to BH detections, allowing us to better fit the observed number of detections in each bin.
Other Images in This Article

Copyright and Terms & Conditions
© 2020. The American Astronomical Society. All rights reserved.