

Image Details
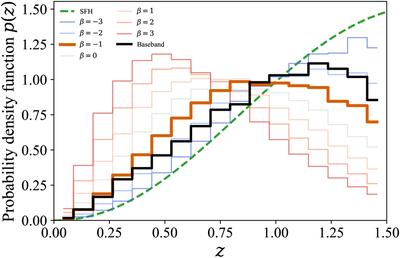
Caption: Figure C1.
Redshift distribution functions from the baseband catalog and from tests with different spectral indices. The baseband-catalog result is shown by the black solid line. After applying the same sample selection as Section 2.1, 64 baseband bursts remain. The marginal fluence selection function is applied to the baseband catalog. Colored solid lines show the inferred redshift distributions for different spectral indices. The β = − 1 case corresponds to the main-text result. The SFH model is shown by the dashed green curve. Because of the limited baseband sample size and for a fair comparison, all distributions are truncated at z = 1.5 and normalized by the area under the curve.
Other Images in This Article
Copyright and Terms & Conditions
© 2026. The Author(s). Published by the American Astronomical Society.

