

Image Details
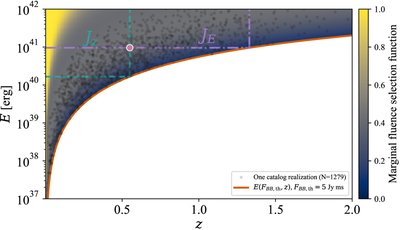
Caption: Figure 2.
z–E distribution for the selected CHIME/FRB Catalog 2 sample. The black points show the catalog events, with the colorbar indicating the marginal fluence-only projection of the selection function. The red solid line represents the fluence-limited selection boundary at Fν,th = 5 Jy ms, which is used to define the comparable sets in the weighted Lynden-Bell C− method. The pink point (zi, Ei) is used to illustrate the definition of the comparable sets ﹩{J}_{{z}_{i}}﹩ and ﹩{J}_{{E}_{i}}﹩, which are defined by the green and purple dashed lines, respectively.
Other Images in This Article
Copyright and Terms & Conditions
© 2026. The Author(s). Published by the American Astronomical Society.

Copyright ©
2026 Astronomy Image Explorer. All Rights Reserved.
