

Image Details
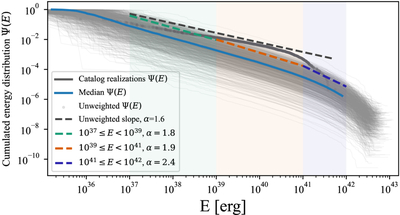
Caption: Figure 4.
Cumulative energy distribution functions. Gray solid curves show the cumulative distributions derived from the 1000 catalog realizations, and the blue solid curve shows their median. α denotes the slope of the power-law energy probability density function, ψ ∝ E−α. Dashed lines show piecewise power-law fits to the cumulative distribution, with different segments indicated by different colors. Gray points show results from the unweighted original C− estimator with the original catalog fluence, which yields a shallower slope.
Other Images in This Article
Copyright and Terms & Conditions
© 2026. The Author(s). Published by the American Astronomical Society.

Copyright ©
2026 Astronomy Image Explorer. All Rights Reserved.
