

Image Details
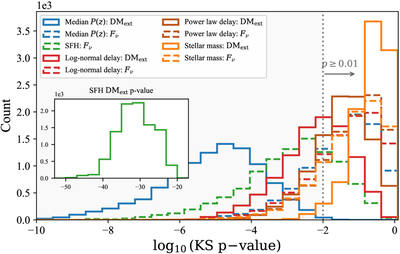
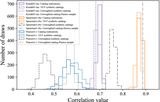
Caption: Figure 7.
Kolmogorov–Smirnov test p-values for DMext and Fν. The same color scheme is used as in Figure 3. The solid histograms show the distribution of p-values of DMext. The dashed histograms show the distribution of p-values of baseband-like fluence. The zoom-in panel shows the p-value distribution of DMext.
Other Images in This Article
Copyright and Terms & Conditions
© 2026. The Author(s). Published by the American Astronomical Society.

Copyright ©
2026 Astronomy Image Explorer. All Rights Reserved.
