

Image Details
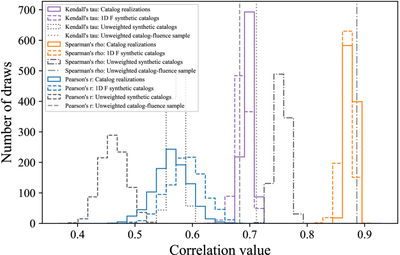
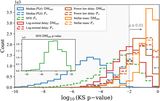
Caption: Figure 5.
Correlation coefficients between redshift and energy. Solid histograms show the coefficient distributions from the catalog realizations. Dashed histograms show the corresponding distributions from 1000 synthetic catalogs generated under the redshift–energy independence assumption and passed through the marginal fluence selection function. Gray vertical lines show the median coefficients from the unweighted inference with the original catalog fluence, and gray dashed histograms show the corresponding unweighted synthetic-catalog distributions.
Other Images in This Article
Copyright and Terms & Conditions
© 2026. The Author(s). Published by the American Astronomical Society.

Copyright ©
2026 Astronomy Image Explorer. All Rights Reserved.
