

Image Details
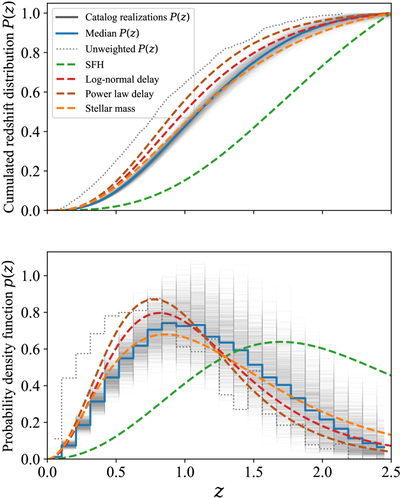
Caption: Figure 3.
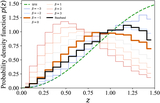
Redshift distribution functions. Upper panel: cumulative distribution functions. Gray solid curves show the cumulative distributions derived from the 1000 catalog realizations, and the blue solid curve shows their median. The green dashed curve denotes the SFH model; the red dashed curve denotes a delayed star formation model with a log-normal delay time distribution with ﹩{\tau }_{{\rm{LN}}}=5\,{\rm{Gyr}}﹩ and ﹩{\sigma }_{{\rm{LN}}}=1﹩; the brown dashed curve denotes a delayed star formation model with a power-law delay time distribution with τc = 5 Gyr; and the orange dashed curve denotes the stellar mass density model. The gray dashed curve shows the unweighted C− result obtained using the original catalog fluence, without the baseband-to-catalog fluence-ratio corrections. Lower panel: probability density functions. The same color scheme is used as in the upper panel. The gray solid histogram shows the probability density function derived from the weighted catalog realizations, while the gray dashed histogram shows the corresponding unweighted result.
Other Images in This Article
Copyright and Terms & Conditions
© 2026. The Author(s). Published by the American Astronomical Society.

